Anurag Koripalli
Purdue University graduate student in Business Analytics and information management focused on bridging the gap between raw data and business impact.

Analytical Projects
End-to-End Analytics Engineering: Real-Time Bitcoin Price Intelligence
December 2025
Project Milestones
- Business Problem Definition: Designed a low-latency analytics system to predict short-term Bitcoin price direction and volatility by combining historical batch data with real-time streaming market signals.
- Cloud Data Architecture: Built a governed end-to-end analytics pipeline on Google Cloud integrating GCS, BigQuery, Cloud Functions, Pub/Sub, and Dataflow for batch + streaming ingestion.
- Analytics Engineering Layer: Modeled curated BigQuery datasets and analytics views to support feature engineering, quality checks, and downstream machine learning workflows.
- Machine Learning at Scale: Trained and deployed a BigQuery ML regression model blending historical and real-time features to generate near real-time price predictions.
- Executive Analytics: Developed an interactive dashboard to monitor live prices, model predictions, error metrics, and ingestion latency for decision-making use cases.
Impact
Delivered a production-style analytics engineering solution demonstrating real-time data ingestion, scalable modeling, and governed ML deployment. The pipeline enables minute-level predictive insights while adhering to cloud security, data quality, and analytics governance best practices.

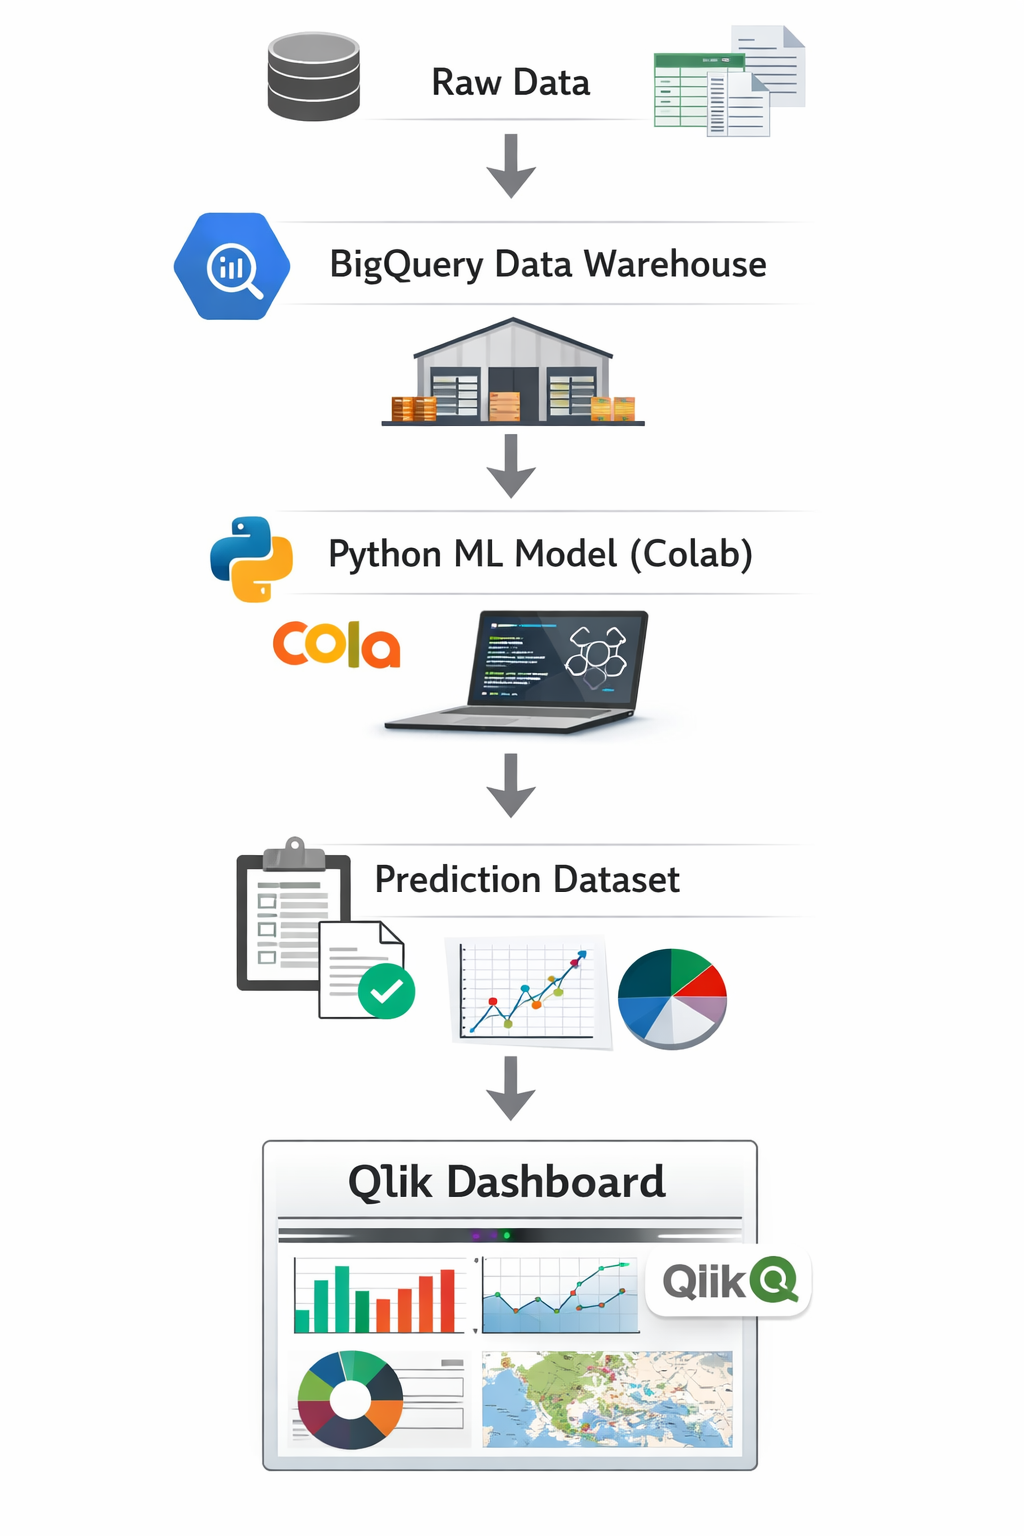
Healthcare Analytics: Hospital Utilization & Prolonged Stay Risk Modeling
November 2025
Project Milestones
- Healthcare Problem Framing: Analyzed 101,766 inpatient diabetes encounters to identify drivers of prolonged hospital stays and evaluate operational factors influencing hospital utilization and readmissions.
- Cloud Data Engineering: Designed a healthcare analytics pipeline using Python and BigQuery to clean, transform, and model hospital encounter data for scalable analytics and downstream machine learning workflows.
- Predictive Modeling: Built a logistic regression model to estimate the probability of prolonged hospital stays, generating patient risk segmentation (Low, Moderate, High) for operational decision support.
- Clinical Utilization Analysis: Conducted exploratory analysis on medication burden, diagnostic complexity, emergency utilization, and demographic factors to understand key drivers of hospital length of stay.
- Executive BI Dashboard: Developed an interactive Qlik dashboard presenting hospital KPIs, predictive risk insights, patient complexity trends, and operational utilization metrics for healthcare leadership.
Impact
Delivered an end-to-end healthcare analytics workflow combining cloud data warehousing, predictive modeling, and interactive dashboards. The system enables hospital stakeholders to identify high-risk patients, understand utilization drivers, and support data-driven decisions around care coordination and length-of-stay management.
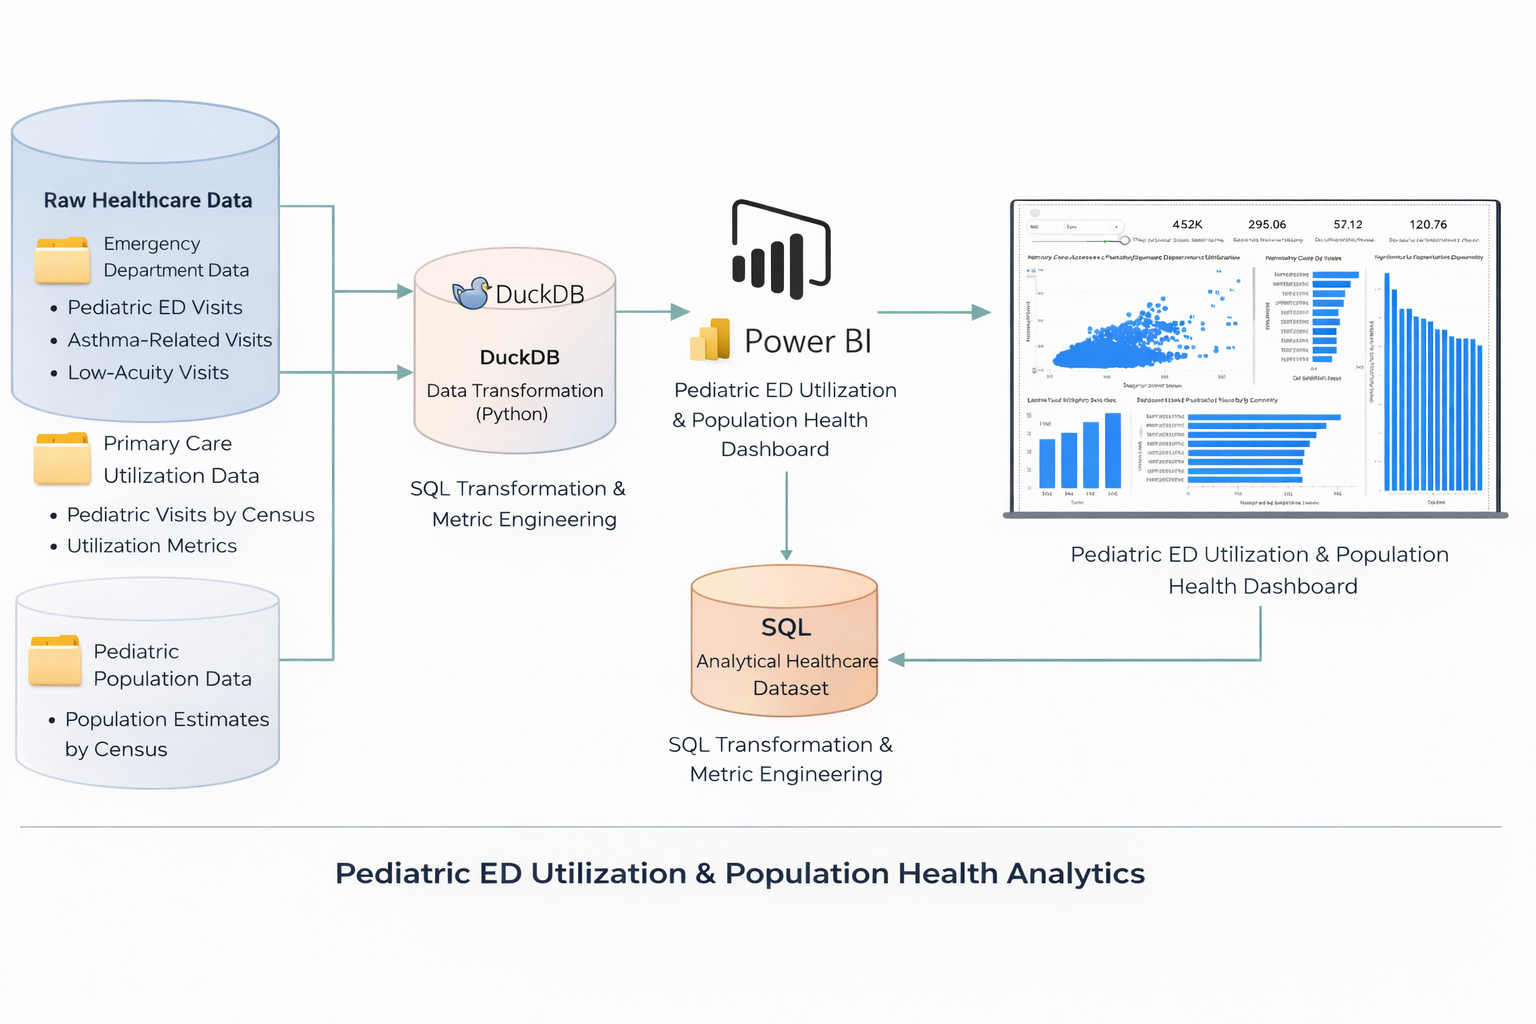
Population Health Analytics: Pediatric Emergency Department Utilization & Community Health Insights
November 2025
Project Milestones
- Population Health Problem Framing: Analyzed pediatric emergency department utilization data across Allegheny County (2016–2019) to identify community-level disparities in emergency care usage and primary care access.
- Healthcare Data Engineering: Integrated emergency department utilization data and pediatric primary care visit datasets using Python (Pandas) to create a population-normalized healthcare analytics dataset at the census geography level.
- Population Health Metric Development: Engineered community-level KPIs including pediatric ED visits per 1,000 children, asthma-related ED utilization, low-acuity emergency visits, and primary care utilization rates.
- Community Health Utilization Analysis: Conducted exploratory analysis to identify high-utilization communities and examine the relationship between primary care engagement and pediatric emergency department demand.
- Healthcare BI Dashboard: Built an interactive Power BI dashboard visualizing ED utilization patterns, asthma burden, pediatric population distribution, and healthcare access disparities across communities.
Impact
Delivered an end-to-end population health analytics workflow integrating healthcare datasets, engineering population-normalized metrics, and building an interactive BI dashboard. The system enables healthcare stakeholders to identify high-risk communities, monitor pediatric emergency department demand, and support data-driven public health interventions targeting preventative care and improved healthcare access.
NBA Ticketing & Revenue Analytics Platform — Demand Modeling & Forecast Validation
August 2025
Project Milestones
- Business Problem Definition: Designed an end-to-end analytics platform to evaluate ticket revenue performance, model demand elasticity, and validate forecast accuracy across a full NBA season.
- Dimensional Data Modeling: Engineered a warehouse-style schema (fact + dimension tables) separating ticket sales, game performance, date, and opponent entities to ensure scalable KPI reporting and eliminate metric duplication.
- Feature Engineering & Demand Drivers (Python): Built performance-based demand variables including rolling win percentage, win streak effects, weekend lift, rivalry flags, and market-size indicators.
- Revenue Forecast Modeling: Developed a regression-based model to estimate predicted revenue using demand drivers and implemented variance diagnostics (Actual vs Predicted) for performance monitoring.
- Executive Dashboard Development (Tableau): Delivered an interactive dashboard featuring KPI summaries, revenue forecast validation, elasticity scatter analysis, opponent-level variance diagnostics, and seasonal utilization heatmaps.
Impact
Built a strategy-focused revenue analytics system that enables leadership to evaluate pricing power, monitor demand fluctuations, diagnose forecast variance, and identify performance-driven revenue opportunities—mirroring the analytical workflows used by professional sports strategy teams.

BMW Global Sales Analysis (2010–2024) — Executive Tableau Dashboard
December 2025
Project Milestones
- Business Problem Definition: Independently designed an executive analytics solution to evaluate BMW’s global sales performance (2010–2024), identify regional growth drivers, and assess long-term EV and hybrid adoption trends.
- Data Modeling & KPI Design: Cleaned, structured, and modeled multi-year sales data to create consistent metrics across regions, fuel types, vehicle models, and pricing bands.
- Dashboard Development (Tableau): Built the full Tableau workbook end-to-end, implementing calculated fields, parameters, hierarchies, filters, and interactive tooltips to enable exploratory executive analysis.
- Trend & Segmentation Analysis: Developed regional and year-over-year sales views, fuel-type transition analysis (petrol, diesel, hybrid, electric), and model-level performance comparisons.
- Pricing & Product Insights: Created price vs sales and high-vs-low sales classification views to evaluate pricing power, model positioning, and demand distribution across markets.
Impact
Delivered a production-quality Tableau dashboard that consolidates BMW’s global performance into clear, decision-ready insights—highlighting Asia and Europe as key growth regions, surfacing accelerating EV and hybrid adoption, and identifying high-performing models to support pricing, product, and regional strategy.

HR Analytics & Workforce Insights — Power BI Executive Dashboard
2025
Project Milestones
- Business Problem Definition: Independently designed a workforce analytics solution to help HR leaders monitor attrition, employee demographics, compensation trends, and department-level performance.
- Data Modeling & Transformation: Built a clean analytical model in Power BI using structured HR data, creating calculated columns and DAX measures to standardize headcount, attrition rate, tenure, and pay metrics.
- KPI & Metric Design: Defined core HR KPIs including attrition %, average tenure, age distribution, job satisfaction, salary bands, and department-wise employee distribution.
- Dashboard Development (Power BI): Developed an interactive, executive-ready dashboard using slicers, drill-downs, and cross-filtering to enable self-service exploration by department, role, gender, and age group.
- Insight Generation: Surfaced attrition drivers and workforce patterns by role, compensation level, tenure, and department to support retention and workforce planning decisions.
Impact
Delivered a decision-ready HR analytics dashboard that transforms raw employee data into actionable insights, enabling leadership to identify high-attrition segments, assess compensation equity, and support data-driven retention and workforce planning strategies.

Professional Experience
Experience across business intelligence, analytics engineering, and applied machine learning, delivering decision-ready insights across multiple domains.

Business Intelligence Analyst
Sep 2025 – Present
Built a centralized SQL analytics warehouse and Power BI dashboards (15+ KPIs), enabling self-service reporting and improving visitor engagement by 20%.

AI Business Analyst Intern
Jun 2025 – Nov 2025
Translated ML forecasting and optimization outputs into actionable insights and trained 30+ planners on AI-driven decision-making.

Student Data Analyst
Jan 2025 – May 2025
Built Python and SAS risk models for 10,000+ home loan applicants, achieving 91% classification accuracy for credit decisioning.

Business Intelligence Intern
Jun 2024 – Aug 2024
Engineered healthcare analytics pipelines using Azure Data Factory and Azure SQL, integrating EHR, admissions, and billing data for hospital utilization analytics.

Business Intelligence Intern
May 2023 – Aug 2023
Analyzed retail sales and inventory data using SQL and Excel, defining demand and inventory KPIs for merchandising teams.
Core Competencies
Technical Skills
- Languages: SQL, Python, R
- Analytics & BI: Power BI (DAX, Power Query), Tableau, Looker
- Data Modeling: Star Schemas, KPI Design, Analytics Views
- Machine Learning: Regression, Classification, Time Series, Feature Engineering
Data & Cloud
- Databases: SQL Server, BigQuery, Snowflake
- Cloud Platforms: Google Cloud Platform (GCS, BigQuery), Azure
- Data Engineering: ETL/ELT, Data Quality Checks, Pipelines
- Workflow & Tools: Git, Jupyter, Airflow (foundational)
Business & Analytics
- Business Intelligence & Executive Reporting
- Stakeholder Communication & Insight Storytelling
- Experimentation & A/B Testing
- Pricing, Operations, and Customer Analytics